Background
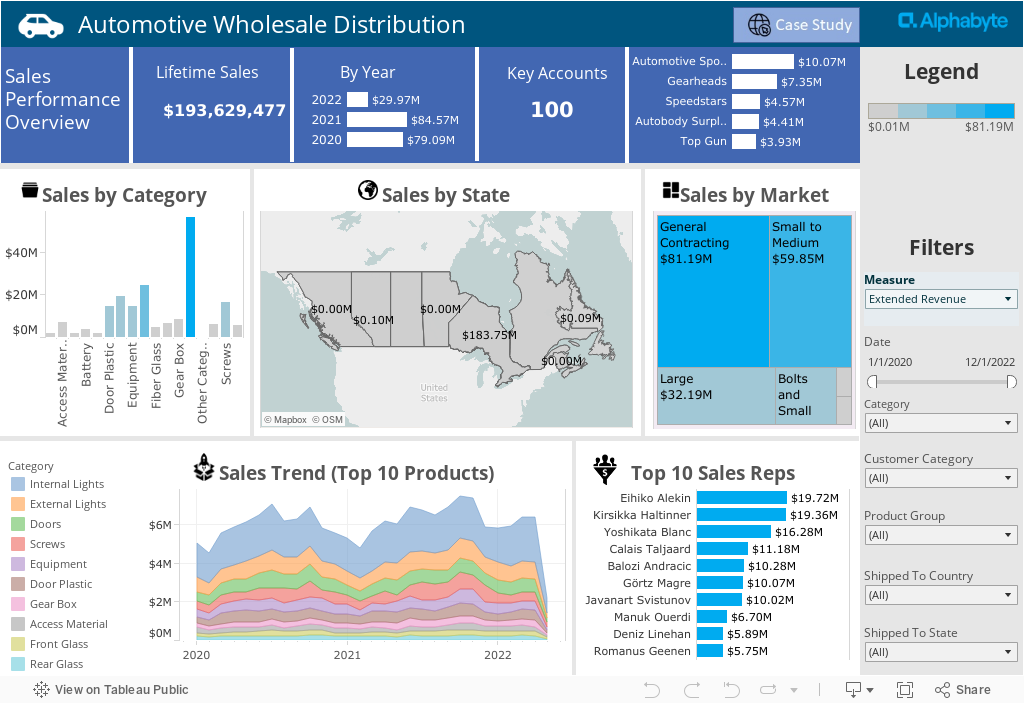
Based in Jacksonville Florida – AWD has been distributing top-quality car parts to their customers with a level of service recognized throughout the industry as exceptional since 1981. With 7 wholesale branches and 3 luxury showrooms located throughout the United States, AWD’s success is directly linked to providing premium customer service; by maintaining a highly educated, knowledgeable team of employees; and embracing new, innovative technology.
Challenge
The wholesale supply industry is fast paced, complex, and highly competitive. Most organizations see a sub-zero bottom line as a problem – where as AWD saw it as an opportunity to maintain a positive year over year growth. AWD recognized that a data-driven solution was needed to increase profitability while maintaining their competitive pricing, ease-of-access and timeliness of delivery. In the Spring of 2016 AWD reached out for expert help from Alphabyte to implement their Analytics strategy to maximize net profitability.
Help Us Make the Right Decisions!
- AWD’s vendor provided ERP system and General Ledger were lumped into one, there was no real way to perform complex financial calculations
- With 7 Branches and 3 Showrooms, AWD did not have a method to detail the breakdown of their P&L at the line item level
- With hundreds of products and sub-products, there was no way to identify the Cost of Goods for individual items.
NET PROFITABILITY MODEL
AWD’s ERP system did contain their financial data. This was helpful to use as repository of finances and account activity, but it was not good enough. What they needed was 21st century answers to a complex 21st century question. Quarterly P&L reports simply did not make the cut. It left many questions unanswered – what is the net profit on each item or branch? Who are our top sales execs? Who are our top customers and how much profit are we generating from them? We had some digging to do. We dug wide and deep into AWD’s ERP and financial systems on a quest to produce an automated product that helps them answer these questions on a Weekly, Monthly and Annual Basis.
A Bird’s Eye View
Executive View
A Success Story
AWD was able to get an overview highlighting the exact breakdown of their P&L using a Tableau Solution. With a daily refresh, completely automated, cleansed, formatted, prorated and aggregated Database – their analytics team is able to dive deep into Revenues, Costs, Profitability – ask question and gather insights to ultimately make informed decision with surgical precision. While many organizations see a dashboard, AWD see 13,723,207 breakdowns of their bottom line, they see a way to manage and forecast their supply chain and inventory – and a grip over changes they can make to increase their bottom line.